
Integral is an employee experience agency, and we’ve spent several years studying the ways in which employee experience – which largely means how you treat your employees – affects employees’ emotions, mindset and behavior.
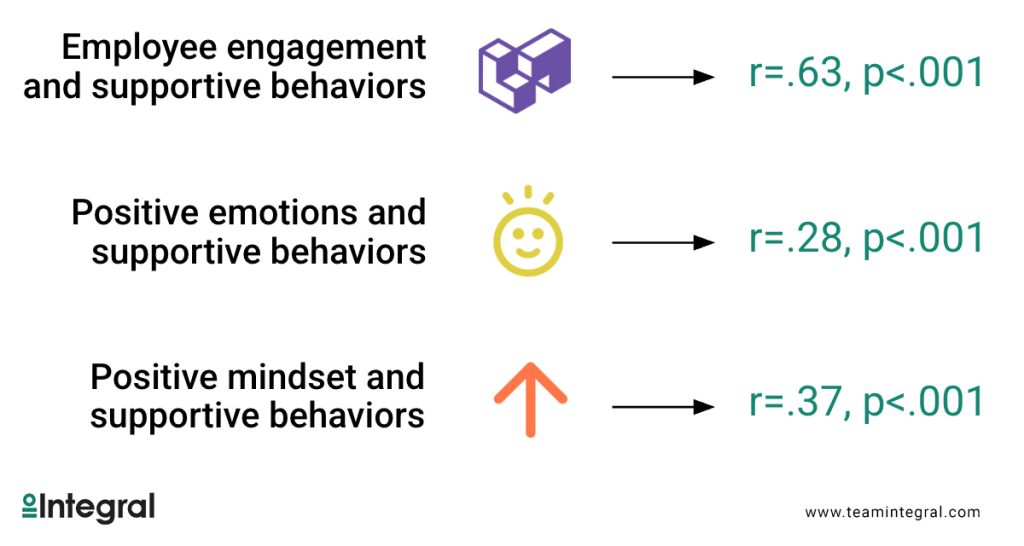
The connection between how you’re treated and how you behave seems intuitive – but we can also prove it quantitatively. We’ve found that employee engagement, positive emotions and positive mindset are all significantly correlated with positive behaviors*:
This data comes from the 2025 Integral Index, released in April. The Index is an annual study of 2,000 US employees, now in its fifth year, that Integral conducts in partnership with The Harris Poll and with the added guidance of Dr. Rita Men, Director of Internal Communications Research at the University of Florida.
This year we went beyond our previous work to look at the drivers of behavior, not just in general, but in terms of specific areas an organization can focus on to improve the employee experience and drive the positive behaviors that lead to positive business results.
How we measure the effect on behavior
Let’s unpack how we do that and then we can look at some specific (and eye-opening) examples. Bear with us – you’ll see the payoff further down the page. OK, fine, skip ahead if you must!

1. We start with a group of employees who answered a certain question a certain way. In the example above, it’s employees who say their organization follows its stated values.
2. Then we look at how that group responds to the four questions we use to assess positive behavior. Do they agree or disagree that they or their colleagues would …
- Stay with the organization through challenging times?
- Go the extra mile for a colleague or client?
- Defend the organization if it were faced with a crisis?
- Share positive work experiences online?
3. Then we look at the difference between those who agree or disagree with each statement. So for the first behavior listed on the left we would say:
“Among those who say their organization follows its stated values, 84% say their colleagues would stay with the organization through challenging times; 51% disagree.” That’s a difference of 33 points!
4. Then we average the responses to the four questions together and see that the average boost in predicted employee behavior is 31 points. Finally, we perform a correlation analysis to show that this finding is statistically significant and very unlikely to occur by chance.
How to drive positive employee behavior
Now you know how we measure; let’s look at what we measure – specifically, the many areas in which an organization’s actions can drive major improvements in positive employee behavior. Here are just a few examples:
| Among those who say that … My direct manager understands the organization’s strategy and direction | The increase in predicted positive behavior is + 41 points |
| Among those who say that … My organization uses or licenses AI tools | The increase in predicted positive behavior is + 17 points |
| Among those who say that … My organization is willing to admit to mistakes when they are made | The increase in predicted positive behavior is + 39 points |
| Among those who say that … People at my organization get promoted based on their performance | The increase in predicted positive behavior is + 29 points |
These are just a few examples; the Index also explores topics including change communications, diversity and belonging, remote and hybrid work, generational differences, and more.
Across all of the topics we’ve studied, one lesson emerges: It’s always personal. To an employee, “employee experience” means their own individual experience. How are they treated by their organization? Their manager? Their colleagues?
Caring about these questions is not just a matter of being humane or making people happier – although those are great objectives! These questions are also part of a very clear business case: If you treat employees well, communicate clearly with them and understand their different perspectives, you’ll be rewarded with loyalty, support and positive behaviors at work.
Want to learn more? Download the Index and let us know if you want to talk. We’re always happy to go deeper on the data!

* Understanding correlation measurements
Measurements that look like this: r =.58
The Pearson correlation coefficient, denoted by “r,” is used to understand the correlation between two variables. The “r” value measures correlation on a scale from -1 to 1. A correlation of -1 indicates that two variables are perfectly and negatively correlated, while a correlation of 1 indicates that they are perfectly and positively correlated. The closer an absolute r value is to 1, the higher the correlation.
Measurements that look like this: p<.001
The “p” value is a measure of probability — specifically, the probability that a given result has occurred by chance. P values range from 0 to 1; the lower the p value, the lower the probability that a result occurred by chance. A value of p < 0.05 is considered statistically significant, and a value of p < 0.001 is considered highly statistically significant.